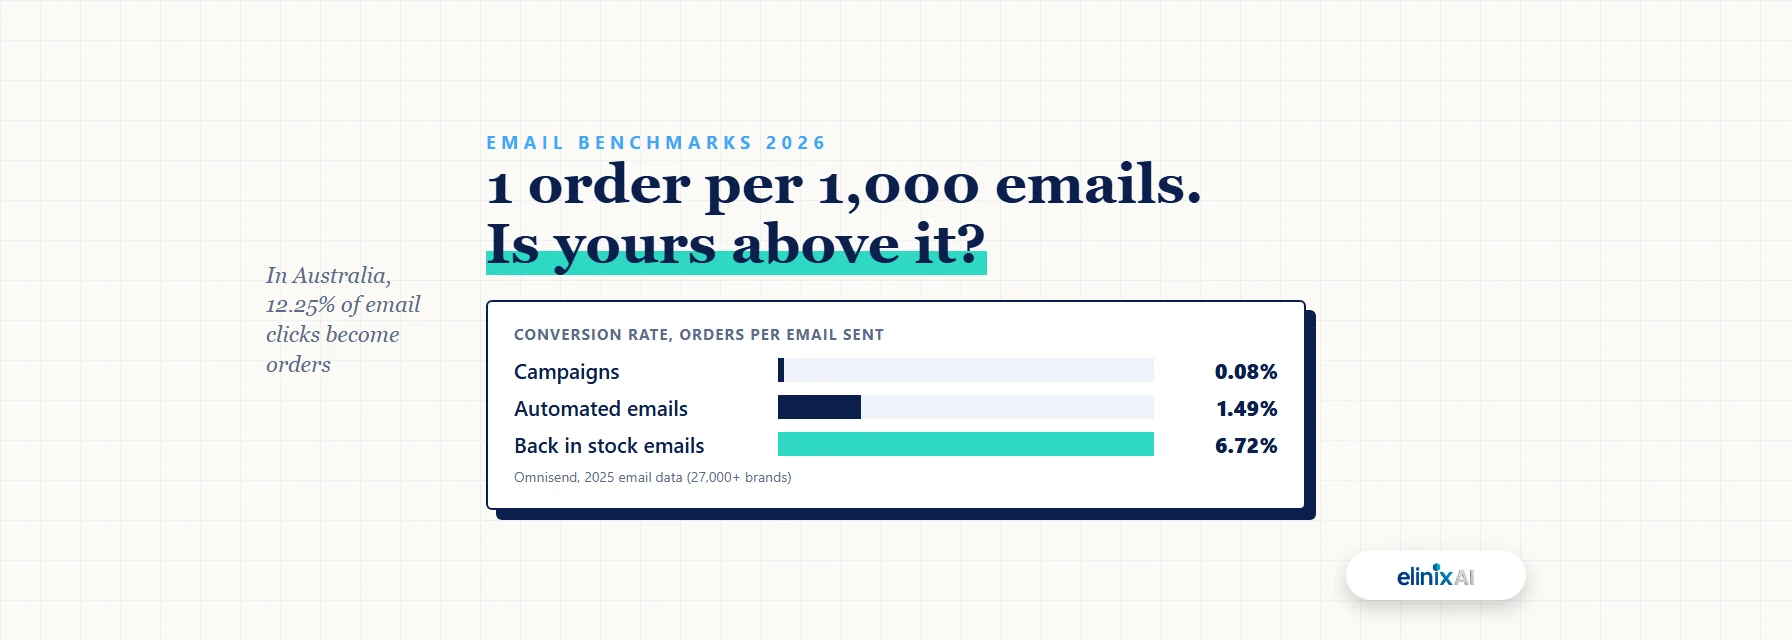
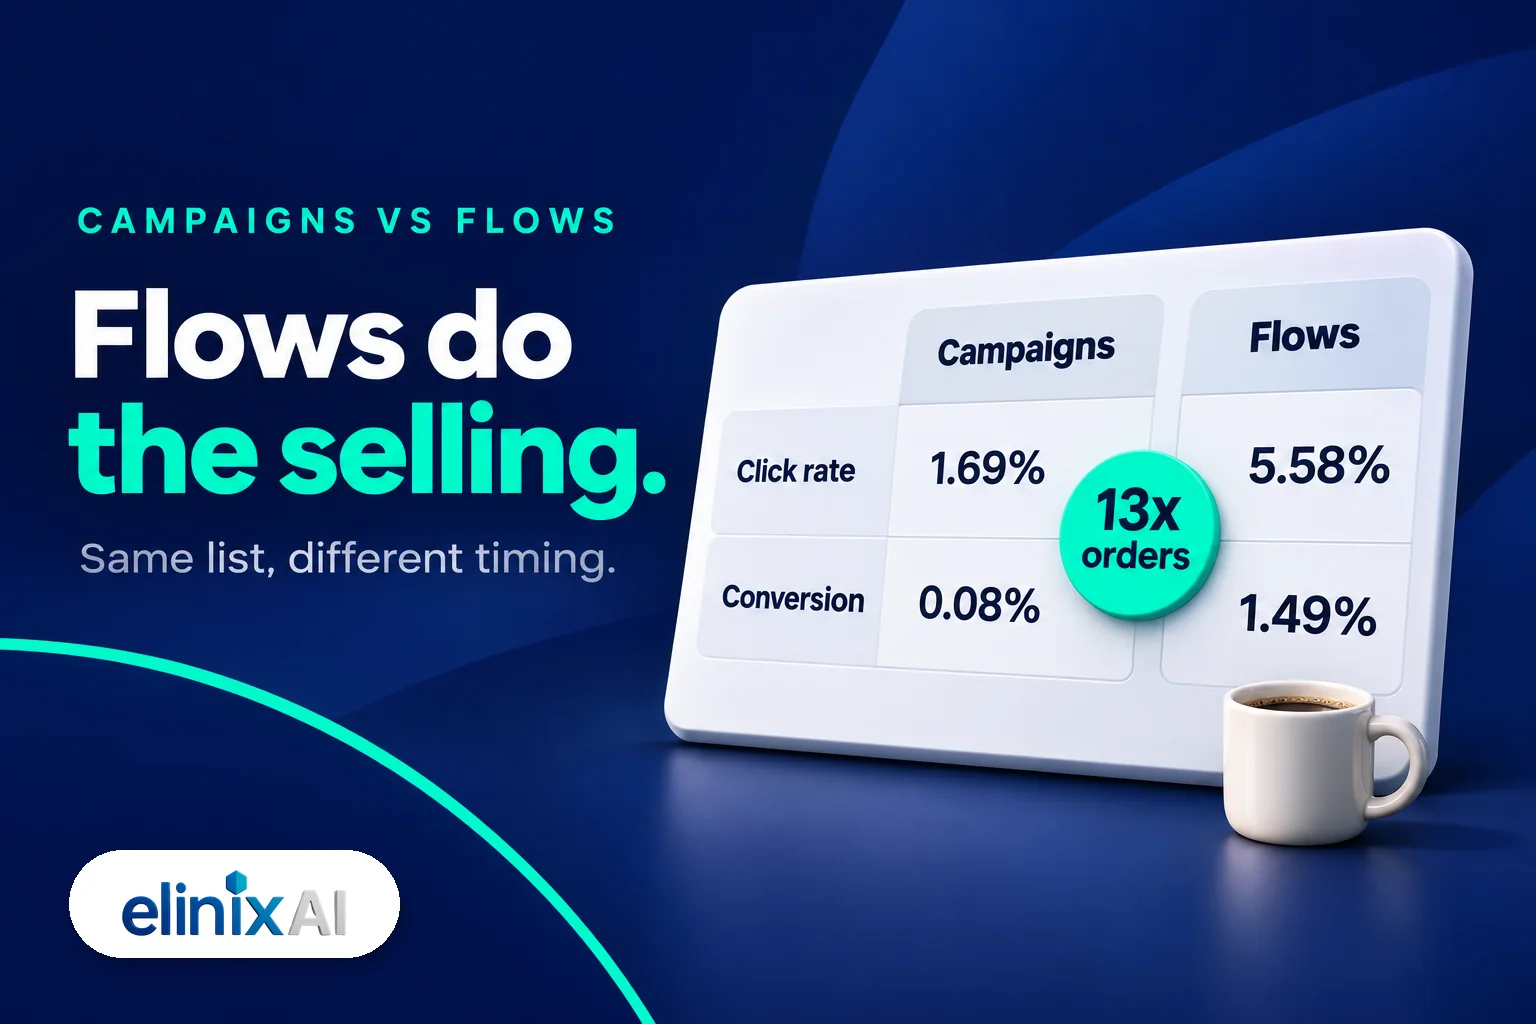
The email conversion rate benchmark for ecommerce campaigns is 0.08%, against 1.49% for automated flows, in Omnisend's 2025 email data. Click rates show the same split, with Klaviyo's 2026 benchmarks putting campaigns at 1.69% and flows at 5.58%. No platform publishes an Australia-only ecommerce figure, but Omnisend found Australian email clicks turned into orders 12.25% of the time, above the 9% global rate.
So a typical campaign gets about 1 to 2 clicks per 100 delivered emails and about 1 order per 1,000. A typical flow gets several times both. This guide sets out the click rate, click to open rate and conversion rate benchmarks by source, by category and by flow, says plainly where Australian data exists and where it does not, and shows how to read your own numbers against them. For open rates, see our companion guide to what a good email open rate is in Australia.
Key facts
- Email campaigns average a 1.69% click rate and flows 5.58% (Klaviyo, 2026, 183,000+ customers)
- Flows have 13 times the placed order rate of campaigns (Klaviyo, 2026)
- Ecommerce campaigns convert at 0.08% and automated emails at 1.49% (Omnisend, 2025 data)
- Australian email click-to-conversion was 12.25%, against 9% globally (Omnisend 2026 report, 2025 data)
- Australian campaigns have a median click rate of 2.82% across all industries (MailerLite, Dec 2024 to Nov 2025)
- Product back in stock emails convert at 6.72%, the highest of any automation (Omnisend, 2025 data)
What do click rate, CTOR and conversion rate measure?
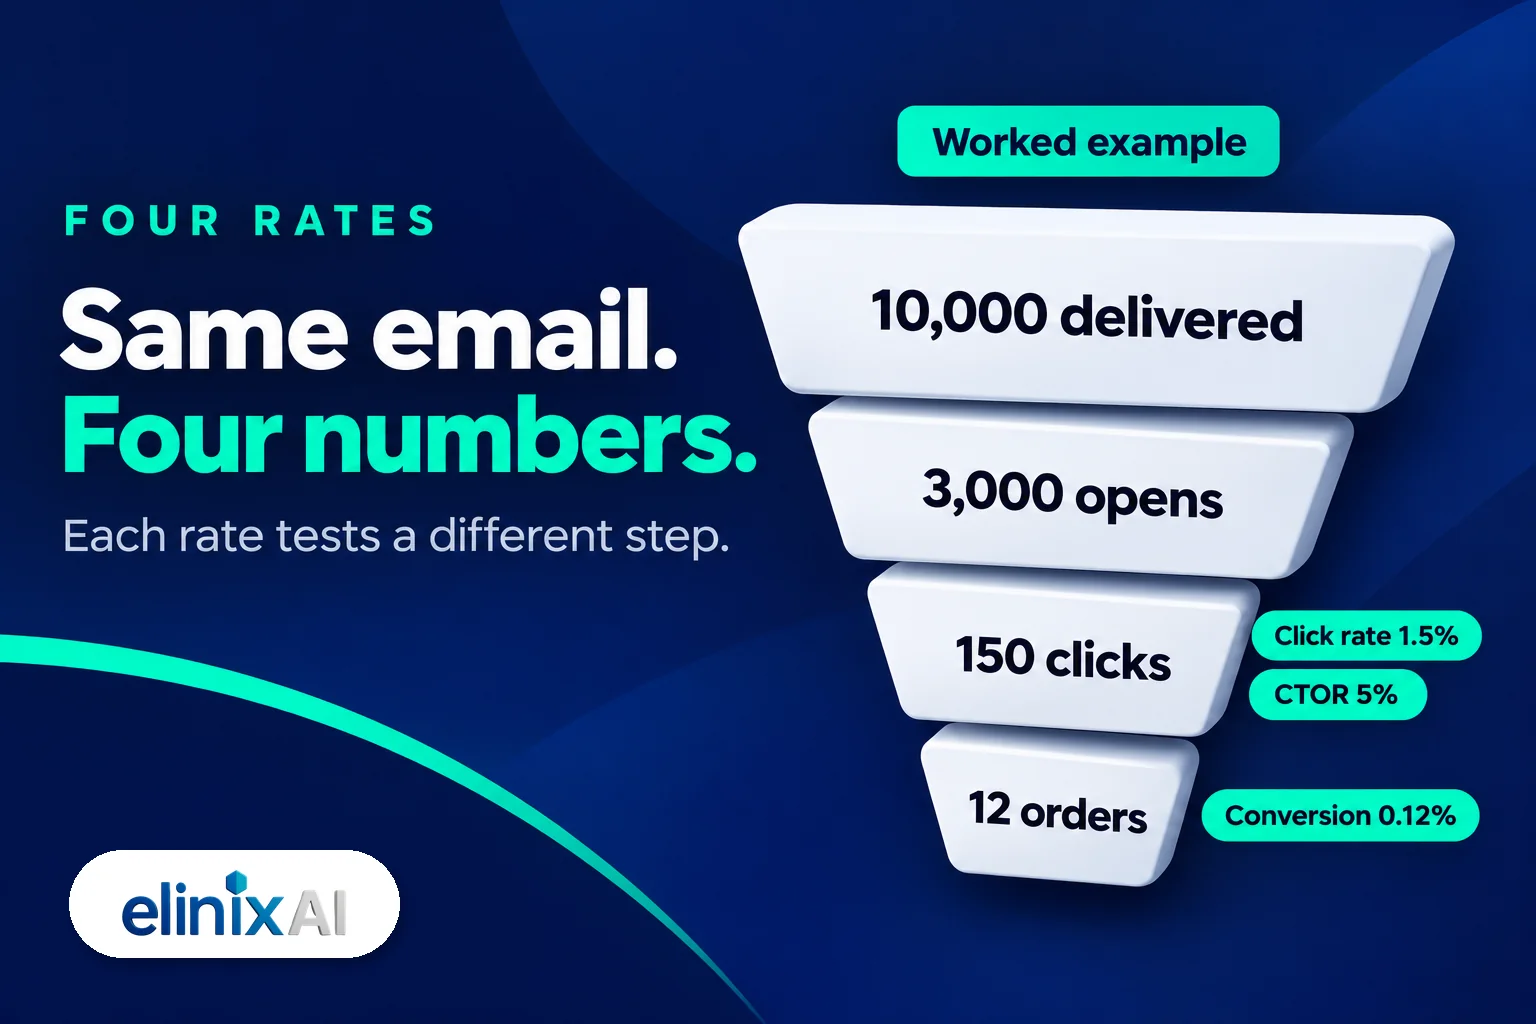
Click rate is clicks divided by delivered emails. Click to open rate (CTOR) is clicks divided by opens. Conversion rate is orders divided by delivered emails, and click-to-conversion is orders divided by clicks. Each one tests a different step, so a weak number tells you where to look.
| Metric | Formula | What it tests |
|---|---|---|
| Click rate | Unique clicks / delivered | The whole email, from inbox to click |
| Click to open rate (CTOR) | Unique clicks / unique opens | The content, once opened |
| Conversion rate (placed order rate) | Orders / delivered | The whole path, from inbox to order |
| Click-to-conversion | Orders / unique clicks | The page the click lands on |
Here is a worked example. A campaign is delivered to 10,000 subscribers and gets 3,000 opens, 150 clicks and 12 orders. Its click rate is 1.5%, its CTOR 5%, its conversion rate 0.12% and its click-to-conversion 8%.
Klaviyo calls conversion rate "placed order rate". Omnisend calls it conversion rate. Both divide orders by recipients, so the numbers line up in principle. In practice they differ, for the attribution reasons covered further down.
CTOR leans on opens, and opens are inflated. Apple Mail Privacy Protection loads emails on Apple devices before anyone reads them, so some recorded opens are not real. That makes CTOR read lower than the true figure, which is why click rate and conversion rate are the safer numbers to benchmark.
What is a good email click rate for ecommerce?
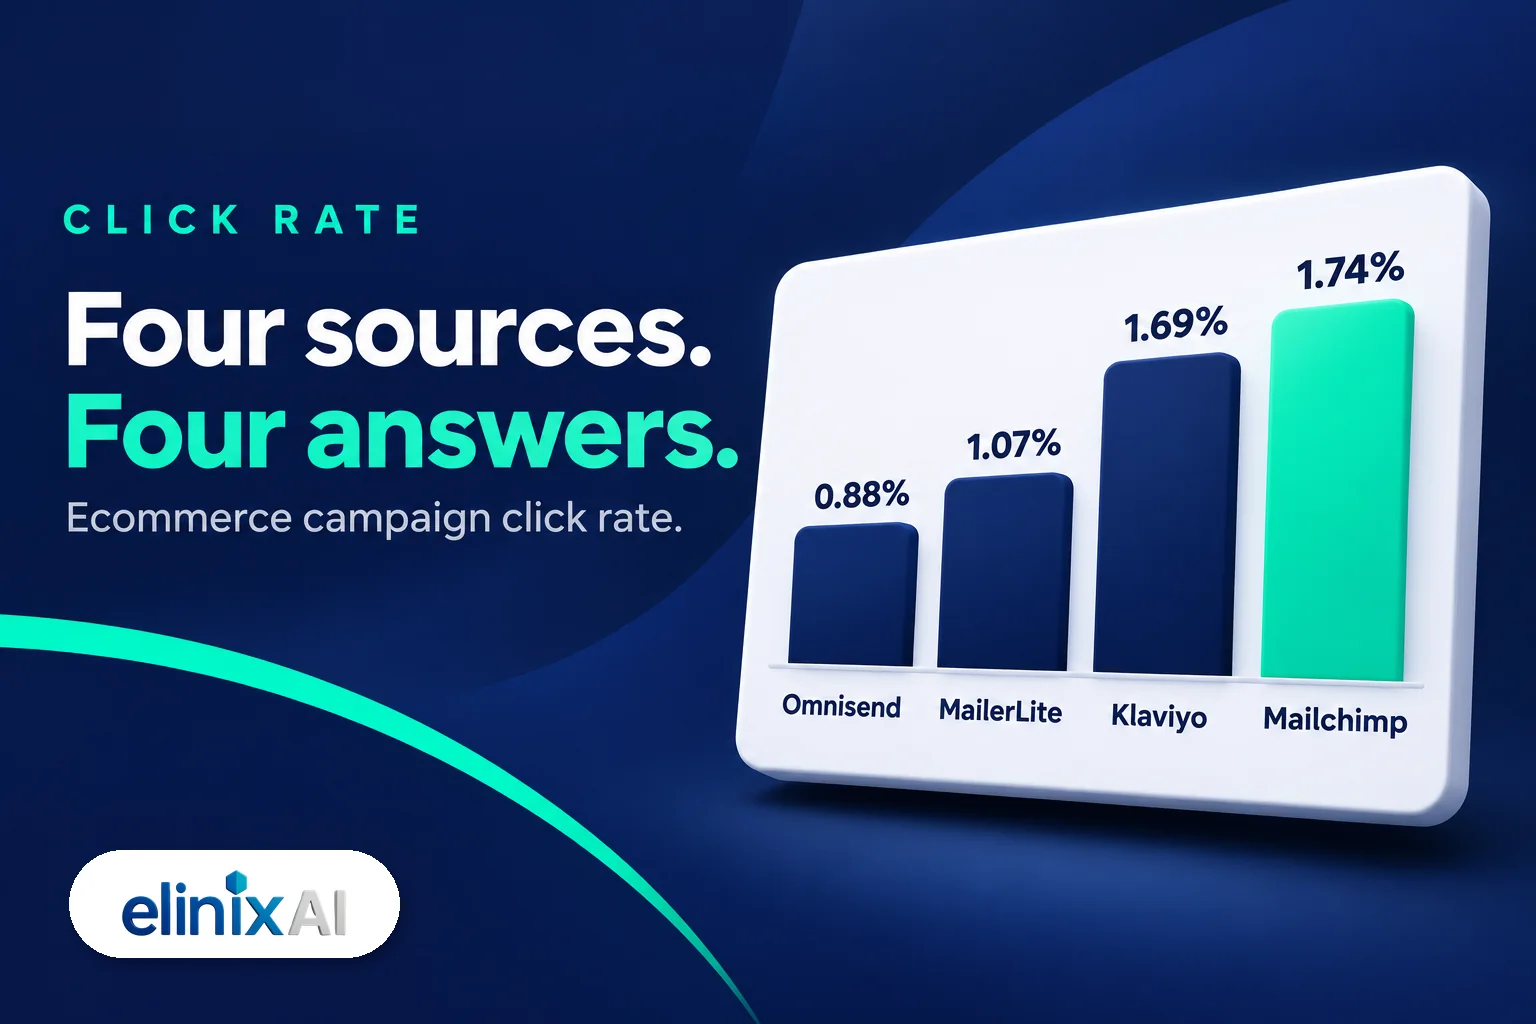
A typical ecommerce campaign click rate sits between 0.9% and 1.7%, depending on whose data you use. A flow should sit well above that, at around 5% to 6%. Klaviyo's top 10% of campaigns reach 3.38%, and its top 10% of flows reach 10.48%.
The four big published sources disagree because they measure different senders, years and statistics:
| Source | Data | Ecommerce campaigns | Flows or automations |
|---|---|---|---|
| Omnisend | 2025, 27,000+ brands, averages | 0.88% | Not published as one figure |
| MailerLite | Dec 2024 to Nov 2025, medians | 1.07% (e-commerce) | Not published |
| Klaviyo | 2026, 183,000+ customers, averages | 1.69% | 5.58% |
| Mailchimp | Dated December 2023, averages | 1.74% | Not published |
Klaviyo's figure is the most useful for a Shopify store on Klaviyo, because it is the same platform, the same tracking and the newest data. The Klaviyo 2026 email benchmarks also show the gap between average and strong:
| Klaviyo 2026 | Average | Top 10% |
|---|---|---|
| Campaign click rate | 1.69% | 3.38% |
| Flow click rate | 5.58% | 10.48% |
MailerLite's 2026 benchmarks report medians, which sit lower than averages when a few senders do very well. Mailchimp's benchmarks page dates its data to December 2023, so treat its 1.74% as the oldest figure in the table.
Click rates are falling in Omnisend's data. Its 2026 report says open rates rose from 26.6% in 2024 to 30.7% in 2025, while click-to-open and click-to-send rates both declined. A click rate a little lower than last year is not, on its own, a sign that your emails got worse.
How do click rates differ by product category?
Klaviyo's 2026 data shows health and beauty with the lowest campaign click rate of any vertical, at 1.24%, while toys and hobbies lead at 2.03%. Flows follow the same order. So a beauty brand at 1.3% is doing fine, and a toy store at 1.3% is behind its peers.
| Category (Klaviyo 2026) | Campaign average | Campaign top 10% | Flow average | Flow top 10% |
|---|---|---|---|---|
| Clothing and accessories | 1.83% | 3.71% | 5.54% | 10.41% |
| Food and beverage | 1.70% | 3.28% | 5.80% | 10.56% |
| Health and beauty | 1.24% | 2.35% | 4.80% | 8.98% |
| Home and garden | 1.78% | 3.41% | 5.96% | 10.81% |
| Jewellery | 1.60% | 3.24% | 5.42% | 10.25% |
| Sporting goods | 1.88% | 3.70% | 6.13% | 11.30% |
| Toys and hobbies | 2.03% | 4.17% | 5.96% | 11.36% |
These are global figures. The Klaviyo page for Australia carries the same data as the US page, with no Australian cut.
Conversion rates spread even more by category. Omnisend's 2025 benchmarks put campaign conversion at 0.15% for food and drink and 0.12% for health, but 0.05% for apparel and 0.04% for home and garden:
| Category (Omnisend 2025) | Campaign click rate | CTOR | Conversion rate |
|---|---|---|---|
| Food and drink | 0.96% | 3.19% | 0.15% |
| Health | 0.79% | 2.77% | 0.12% |
| Pets and animals | 0.78% | 2.60% | 0.10% |
| Sports | 0.99% | 3.22% | 0.09% |
| Beauty and fitness | 0.72% | 2.45% | 0.07% |
| Apparel | 0.86% | 2.76% | 0.05% |
| Home and garden | 0.87% | 2.85% | 0.04% |
Consumables tend to convert better because people reorder them. Apparel and homewares buyers compare more before they buy, so a single campaign does less of the selling.
What is a good email conversion rate for ecommerce?
Around 0.08% is the average conversion rate for an ecommerce campaign, and 1.49% for an automated email, in Omnisend's 2025 data. That is about 19 times higher for automations. Klaviyo reports the same pattern from its own customers, with flows reaching 13 times the placed order rate of campaigns.
A campaign converting at 0.1% to 0.15% is ahead of the average in most categories. A flow below 1% deserves a look, unless it is a browse, post-purchase, cross-sell or winback flow, which convert lower by design.
Klaviyo's page explains where that matters. According to Klaviyo, flows generate nearly 41% of email revenue from 5.3% of sends, and nearly 48% of flow revenue comes from new buyers, against 16% for campaigns. So the flows doing the most first-purchase work are the welcome, browse and abandonment flows.
What happened for one Australian beauty brand we work with shows the same split. After a 30-day Klaviyo email and SMS build, flows produced 63.02% of its email revenue, and email reached 53.24% of total store revenue against the prior 30 days. That is one brand's result, not a benchmark, and not a promise for your store.
If your flows are thin, start with the essential Klaviyo flows for Shopify stores before you try to lift campaign conversion.
Which email flows have the highest click and conversion rates?
Product back in stock emails convert best, at 6.72% in Omnisend's 2025 data, followed by welcome emails at 2.11% and abandoned cart at 1.72%. Customer reactivation converts lowest, at 0.54%. Only 0.6% of brands in Omnisend's dataset ran a back in stock automation in 2025.
| Automation (Omnisend 2025) | Click rate | CTOR | Conversion rate |
|---|---|---|---|
| Product back in stock | 21.31% | 37.05% | 6.72% |
| Welcome | 3.94% | 11.19% | 2.11% |
| Abandoned cart | 4.13% | 11.12% | 1.72% |
| Order follow-up | 4.12% | 8.63% | 0.93% |
| Cross-sell | 3.02% | 7.18% | 0.87% |
| Page viewed (browse) | 8.53% | 18.59% | 0.59% |
| Customer reactivation | 1.99% | 6.00% | 0.54% |
Browse emails get a high click rate but a low conversion rate. People click back to the product they were looking at, then many still do not buy. Treat a browse flow's clicks as a sign of interest, and judge it on orders.
Welcome and abandoned cart do most of the selling. Omnisend's 2026 report says those two drove 76% of all automation-generated orders in 2025. If you only fix two flows this quarter, fix those.
Free audit: not sure which of your flows sits below these numbers? Book a free audit and we will compare your Klaviyo click and order rates with the benchmarks above.
Are there Australian email click and conversion benchmarks?
Partly. MailerLite publishes an Australian click rate and CTOR, and Omnisend publishes an Australian click-to-conversion rate. MailerLite's figures cover all industries, and Omnisend's measures orders per click, not orders per email sent. No major platform publishes an Australian conversion rate for ecommerce campaigns or flows. Klaviyo's Australian benchmark page uses its global data.
| Australian figure | Value | Source and scope |
|---|---|---|
| Campaign click rate | 2.82% median | MailerLite, Dec 2024 to Nov 2025, all industries |
| Click to open rate | 8.30% median | MailerLite, same data |
| Click-to-conversion | 12.25% | Omnisend 2026 report, 2025 data |
| Ecommerce conversion rate | Not published | No platform reports it |
MailerLite's Australian click rate of 2.82% beats its US and Canada figure of 2.14%. But it covers every industry, and MailerLite's own e-commerce median is 1.07%. So do not hold an Australian online store to 2.82%.
The Omnisend figure is the most useful one for a store owner. According to Omnisend's 2026 ecommerce marketing report, the UK led click-to-conversion at 16.54%, followed by Australia at 12.25%, against a 9% global rate. Australians who click a marketing email buy more often than shoppers in most markets Omnisend reports on.
So the practical benchmark for an Australian store is the global ecommerce click and conversion figures above, with click-to-conversion held to the Australian 12.25%. If your clicks are near average but click-to-conversion is well under 9%, the problem is on your website, not in your emails.
Why do platform conversion rates not match?
Each platform counts an order as an email conversion under its own rules. Klaviyo's default credits an order to an email opened or clicked in the previous 5 days. Omnisend's default is 7 days. Shopify counts sales differently again. So the same campaign can show three different conversion rates.
| Platform | Default email window | What counts |
|---|---|---|
| Klaviyo | 5 days | An open or a click, last touch |
| Omnisend | 7 days | An open or a click |
Klaviyo's help centre sets the defaults at 5 days for email opens and clicks, crediting the most recent message. Omnisend's help centre uses 7 days and counts Apple Mail Privacy Protection opens as engagement by default. Both windows can be changed in the account settings.
Two things follow. First, benchmark your conversion rate with the platform's default settings, or the comparison is unfair. Second, an open-based window credits emails for orders that some shoppers would have placed anyway. Click-based numbers are the stricter test.
If you are choosing between platforms, our Klaviyo vs Mailchimp comparison for Australian stores covers how each one reports revenue.
How should you read your own numbers against these benchmarks?
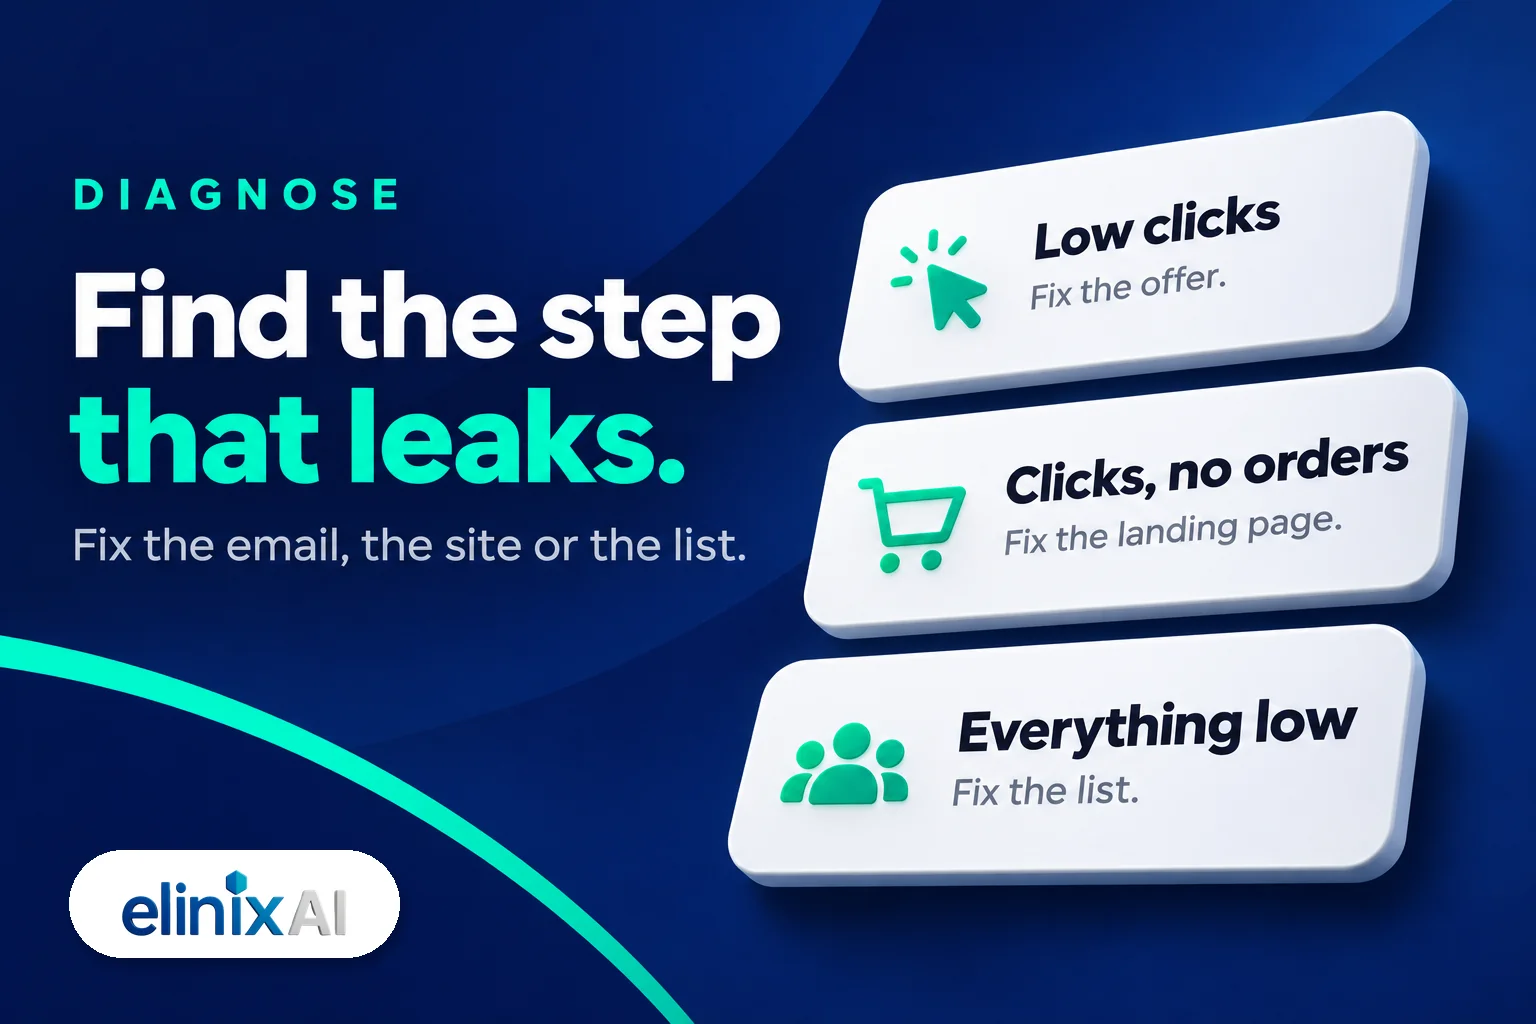
Compare campaigns with campaigns and flows with flows, use your platform's default attribution, and look at the last three months, not one send. Then find the step where you fall furthest below the benchmark. That step tells you whether to fix the email, the website or the list.
| Your numbers | Likely cause | Look at first |
|---|---|---|
| Opens fine, campaign click rate under 1% | The email is not earning the click | Offer, product choice, layout, call to action |
| Clicks fine, click-to-conversion well under 9% | The page after the click is losing the sale | Landing page, stock, price, shipping cost |
| Flow click rate under 4% | Flow timing or content | Delays between emails, subject lines, product blocks |
| Opens, clicks and orders all low | Deliverability or list health | Inactive subscribers, sender authentication |
When clicks arrive and orders do not, the leak is usually on the site. Our guide to what an ecommerce redesign costs in Australia covers the fixes that usually come first, and how they are priced.
Timing matters this month. Omnisend's 2026 report found clicks dropped in the last quarter of 2025 while average order value nearly doubled, so judge November against last November, not against October. Our Black Friday email calendar for Australian Shopify brands sets out which emails to send and when.
For the bigger picture on how email fits a store's revenue, see what email marketing is and how it works for ecommerce. If you would rather have a team run this, here is how our Klaviyo email marketing service works.
Frequently Asked Questions
What is a good click rate for a Klaviyo flow?
Klaviyo's 2026 benchmarks put the average flow click rate at 5.58% and the top 10% at 10.48%. Health and beauty flows run lower, averaging 4.80%. A flow below about 4% is worth checking for timing, subject lines and product content.
Is there an Australian email conversion rate benchmark for ecommerce?
No major platform publishes one. The closest Australian figures are MailerLite's 2.82% median click rate across all industries and Omnisend's 12.25% click-to-conversion rate. For conversion, use the global ecommerce figures of 0.08% for campaigns and 1.49% for automations.
What is click-to-conversion rate?
Click-to-conversion rate is orders divided by unique clicks. It shows how well the page after the click turns interest into a sale. Omnisend's 2025 data puts it at 9% globally and 12.25% in Australia.
Why is my email click rate falling while open rates rise?
Open rates are inflated by Apple Mail Privacy Protection, while clicks need a real person. Omnisend's 2026 report found opens rose from 26.6% in 2024 to 30.7% in 2025 as click rates declined, but click-to-conversion rose from 5.9% to 9%. Fewer people clicked, and more of them bought.
Why does Klaviyo show a different conversion rate from Shopify?
Klaviyo credits an order to an email opened or clicked in the previous 5 days by default, while Shopify uses its own attribution. Omnisend's default window is 7 days. Compare each platform with its own benchmarks, and use click-based figures as the stricter test.
Which email automation has the highest conversion rate?
Product back in stock emails, at 6.72% in Omnisend's 2025 data, then welcome emails at 2.11% and abandoned cart at 1.72%. Only 0.6% of brands in Omnisend's dataset used a back in stock automation in 2025.